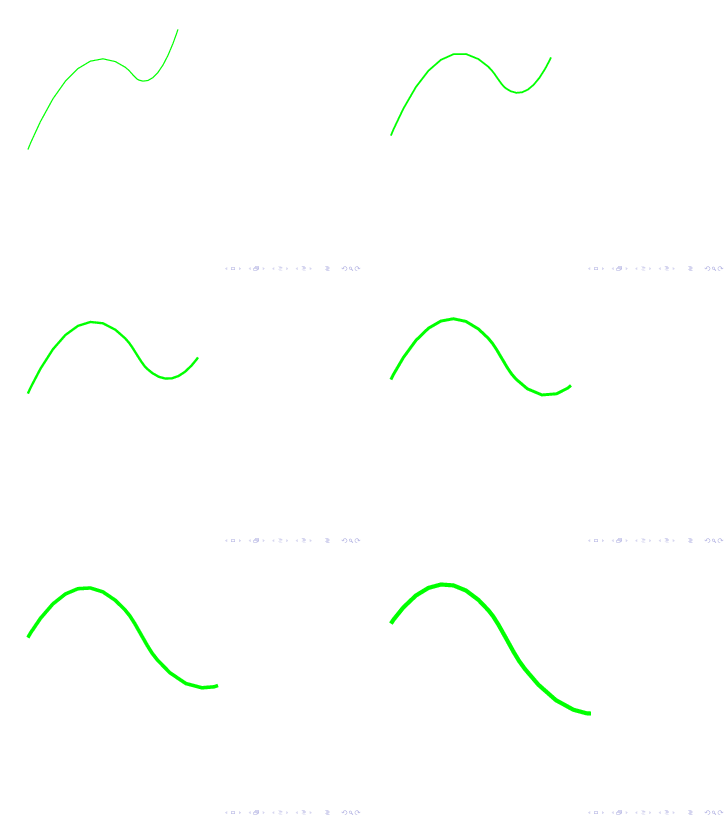
    axocurve({"points" => [[[-100,-50],[-100,20]],
			   [[0,30]],
			   [[10,20],[30,-20]],
			   [[50,70],[100,-70]]
		  ],
			       "width" => [[1],[4]],
			       "color" => "Green"});
Note that axocurve only works if the curve can be represented
as an injective function f(x)=y, i.e. no loops etc are allowed.
